This is the 30th anniversary year of Manteca blazing the trail to become the first San Joaquin Valley city to implement a growth cap.
Since the implementation of Ordinance No. 800 that limits annual housing unit growth based on sewer connection allocations to 3.9%, Manteca has never reached the cap. Other cities that have adopted growth caps since 1988 have put in place exact numbers in terms of the housing units allowed in a given year.
It begs the question whether the city’s growth management ordinance is still relevant.
Councilman Richard Silverman, for one, believes it is.
Although he concedes developers and most other people don’t give it much thought, the fact that it is “still there keeps it at the back of everybody’s mind.”
Silverman said that means if the market pushes the growth rate up to where it is nearing the cap, it will force everyone to stop and think about what they are doing.
“It sends a message,” Silverman said.
While the citizens committee working to update the city’s general plan — the state-mandated blueprint for growth — will discuss the city’s growth management policies at their next meeting on Aug. 6, they aren’t scheduled to be reviewing the growth management ordinance per se.
The agenda report does include a reference to three cities including two — Antioch and Sebastopol — that have imposed a maximum number of housing units that can be built in a given year that is consistent year after year.
The advisory committee meets on Monday, Aug. 6, at 6 p.m. at the Manteca Transit Center, 220 Moffat Blvd.
In Manteca, the number of residential sewer allocations that can be issued in any given year is 3.9 percent. The number is obtained by taking the overall count of housing units within the city limits on Dec. 31 each year — single family homes, apartment units, mobile homes, duplexes, triplexes, condos, and townhouses — and multiplying the total by 3.9 percent.
The basic framework of the growth management ordinance adopted in 1988 means the real cap in terms of the number of homes that can be built in a given year keeps growing. Last decade elected leaders amended the ordinance to exempt age-restricted housing such as Del Webb at Woodbridge, affordable housing as defined by the city’s housing element, and secondary housing known as granny flats on existing residential lots that already have a home on them.
Any allocations awarded to developers that are unused can be rolled over by developers for one year. Development agreements — that came into vogue two decades ago — provide multiple year allotments in exchange for what has been described as “enhanced development.”
Almost all other city growth management plans set a firm number.
Tracy, as an example, has a growth management board in place that awards an average of 600 residential growth allocations (housing units) although another 150 can be issued in a given year if they meet affordability guidelines.
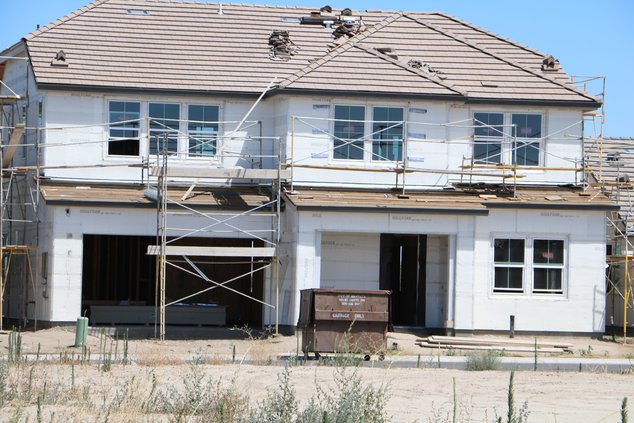
Manteca in 2017 recorded its third highest year for the new housing units with 822 units being started that included 660 single family homes and 162 apartment units. In terms of single family homes, 2017 was the fifth biggest year on the books for Manteca with 669 starts. It was eclipsed by 1,410 homes in 1985, 1,075 homes in 2000, 803 homes in 2002, and 746 homes in 2004.
How Manteca’s growth
management got started
While Manteca set the trend when it comes to controlled growth in the Northern San Joaquin Valley, its 30-year old cap rule is now arguably the most liberal.
The push for a growth cap started when a group known as the Concerned Citizens for Planned Growth rolled out a plan to put a 2 percent growth cap on the ballot and started collecting signatures. It was countered by developers who wanted a 4.5 percent growth cap instead.
That prompted then Mayor Jack Snyder to roll out an initiative plan that basically mirrored the 3.9 percent growth cap on residential housing. Developers backed down and ultimately the more stringent 2 percent growth cap didn’t qualify for the ballot.
The 1970s had ended with four strong growth years capped with a 12 percent gain in residents in 1980 that took the city’s population from 20,187 to 25,641 or an increase of roughly 25 percent in 48 months.
The growth rate slowed a bit but then it hit a record 12.1 percent in 1985 followed by a 9.2 percent jump in 1986 that took Manteca’s population up from 29,027 to 35,437 in two years. Manteca today —some 33 years later — has almost 82,000 residents.
The proverbial straw that broke the camel’s back was the city’s inability to keep up with growth. Fees on growth were inadequate or non-existent for a wide variety of amenities such as parks and fire services.
Manteca was bouncing back
from near bankruptcy
The city was still recovering from a near-bankruptcy episode in 1980 when the budget reserve was a razor-thin $1,800. Manteca’s financial trials were heavy on civic leaders’ minds during the building boom of 1984 to 1987. They didn’t want a repeat of the 1980s experience which forced the city to leave the just completed Louise Avenue fire station unopened because they couldn’t afford to staff it while city police were using old CHP cars with excess of 90,000 miles on them when the city took delivery of them as primary patrol units.
Many residents shared the concern that Manteca was growing faster than basic services could keep up with. The sentiment was Manteca was growing too fast as neighborhoods such as Mayors Park in the triangle formed by the railroad tracks, Louise Avenue and Union Road seemed to develop overnight.
The ordinance went into effect just as the economy started receding. It would take 12 years before the cap would be pushed in a particular year.
Tying into sewer allocations was viewed by legal experts and civic leaders at the time as the easiest way to implement a growth management plan.
Ordinance No. 800 was put into effect on Aug. 16, 1988 as the guideline for how the first phase of the municipal wastewater treatment plant expansion would be utilized to divide sewer capacity. It was subsequently extended in future years to govern how the second phase of the treatment plant would have its capacity parceled out.
A percentage was set aside for every category in terms of how much capacity of the plant would be allocated to a particular use. Those percentages set aside 60 percent of the overall capacity to housing with no distinction being between apartments, single family homes, duplexes or mobile homes. The other categories — schools, industrial, retail and office divided the rest of the capacity.
Based on the intent and the actual wording of Ordinance No. 800, city leaders view the growth management plan as a success.
That, however, isn’t a universal view. There are those who believe the city has been growing too fast.
Originally the growth cap gave projects two windows to secure sewer allocations — one in March and the other in October.
The advent of development agreements tied into “bonus bucks” — fees paid to secure sewer allocation fees — were advanced by the development community in 1998 to avoid the potential for lawsuits among builders when 13 projects were moving forward at once. The bonus bucks generated more than $30 million for the city to spend without restriction. They used $11.9 million to avoid city cutbacks for a number of years when expenditures exceed revenues. The city has now had a balanced budget for more than three consecutive years.
The balance of the bonus bucks have helped pay for amenities such as soccer field lights at Woodward Park, traffic signals on the Tidewater Bikeway, more than half of the construction of the Union Road fire station and other amenities including aerial fireworks on the Fourth of July.
To contact Dennis Wyatt, e-mail dwyatt@mantecabulletin.com