
The four map options demographers have created for Manteca’s move to district elections will be vetted for the first time Tuesday.
The Manteca City Council has scheduled a special meeting for 6 p.m. at the Civic Center, 1001 W. Center St., for public input regarding the four drafts.
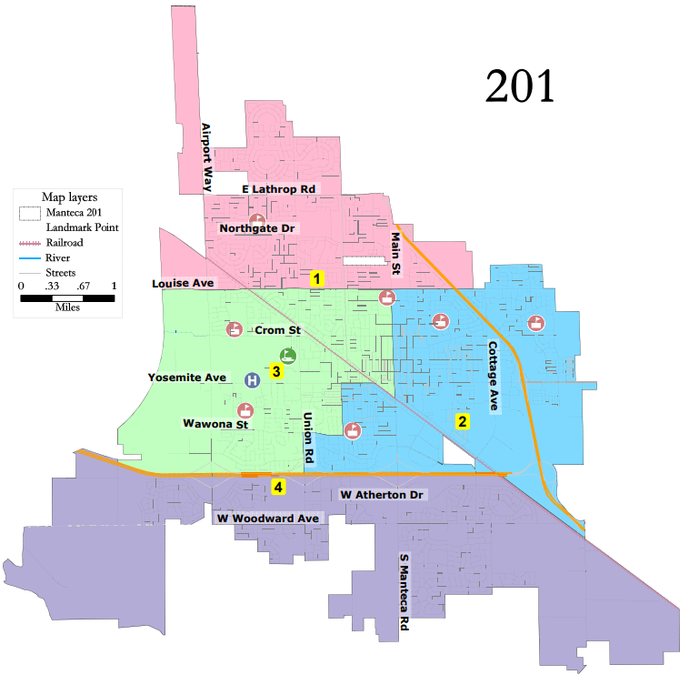
In terms of the least confusing lines, the cleanest map is the one dubbed 201.
Based on the proposed 201 map:
*District 1 where Councilman Jose Nuño resides is everything north of Louise Avenue except for areas east of the age-restricted Trumark Homes’ The Collective that at build out will have 400 plus homes. That means the bulk of Manteca’s age-restricted housing would be in District 1 as it included the 1,406-home Del Webb neighborhood.
Based on demographic data the district boasts the highest voter turnout based on the 2018 and 2020 elections, has the highest concentration of residents 60 years and older at 23 percent, the highest fluency in English at 78 percent, the lowest amount of immigrants at 12 percent, and ties District 4 for the highest percentage of single family homes at 88 percent.
*District 2 where councilman Dave Breitenbucher resides covers most of east Manteca as well as almost all of central Manteca.
The district’s southern boundary runs east along the 120 Bypass and then angles to the southeast to take in area east of the railroad tracks.
The western boundary goes north from the 120 Bypass along Union Road, jogs to the east along Wawona Street, then heads north on Locust Avenue before jogging east again along Yosemite Avenue. It turns to the southeast at the railroad tracks and takes a sharp turn at Main Street where it heads north to Louise Avenue where it heads east.
The district as drawn would include part of downtown, Manteca High, the Manteca museum, Walmart, Doctors Hospital of Manteca, Spreckels Park and the proposed site of the city’s homeless shelter.
Based on demographic data the district has the highest concentration of Hispanics at 47 percent of the proposed district’s population, 26 percent of its households speak Spanish (the highest in Manteca), it has the highest percentage of high school grads at 60 percent, it has the highest concentration of renters at 48 percent, and the largest number of households making less than $25,000 a year.
*District 3 where Councilman Charlie Halford resides is south of District 1, west of District 2 and north of the 120 Bypass to Union Road in the east.
The proposed boundaries include East Union High, Sierra High, Kaiser, Great Wolf, Costco and part of downtown.
Based on demographic data the district ties district 4 for having 55 percent of its population between the ages of 20 and 60 and also ties District 4 for having the highest number of immigrants among its population at 20 percent. It has the highest percentage of multiple family housing in the city at 22 percent.
*District 4 where Councilman Gary Singh resides includes everything south of the 120 Bypass and west of the railroad tracks.
It includes The Promenade Shops at Orchard Valley and Woodward Park.
It also encompasses three significant housing developments that have broken ground since the 2020 census including the 1,301-home Griffin Park along South Main Street.
It is why it was drawn it includes 10,836 residents as of April 1, 2020. The other districts as drawn have populations ranging from 13,753 to 14,532.
Based on demographic data the district has the city highest concentrations of Asian-Americans at 31 percent and Blacks at 7 percent, has the highest percentage of the population under age 19 at 31 percent, has the highest concentration of those with bachelor degrees at 14 percent and those with graduate degrees at 9 percent, the highest percentage of households with a child at 48 percent, 65 percent of those 16 and older are employed for the highest mark in Manteca, ties district 1 for having 88 percent of its housing as single family homes, leads in home ownership at 72 percent, and is the leader in terms of percentage of households with income between $75,000 and $200,000 at 54 percent, and 11 percent of its households have incomes in excess of $200,000.
Maps may change
political landscape
Map 201 underscores how going to districts can alter Manteca’s political landscape.
Had the district map been in places six years ago it would have included the homes of Debby Moorhead, Richard Silverman, and Gary Singh who were all on the council at the time. It would have meant two of the three could not have run for the City Council.
Overall Map 201 also essentially reflects how growth is occurring in Manteca with District 1 including the northern movement and District 4 growth to the south.
District 3 has little area that could go toward future housing growth.
The four maps are posted on the city’s website. They can be accessed by going to the city’s website and visiting DistrictingManteca.org/Draft-Maps to view the first draft maps.
To contact Dennis Wyatt, email dwyatt@mantecabulletin.com